Financial information
Financial targets
| ORGANIC GROWTH | PROFITABILITY | FINANCIAL POSITION |
| Over 200 MEUR annual revenue by 2028 | Adjusted operating profit margin >10% by 2028 | Net debt / adjusted EBITDA* <3x by 2028 |
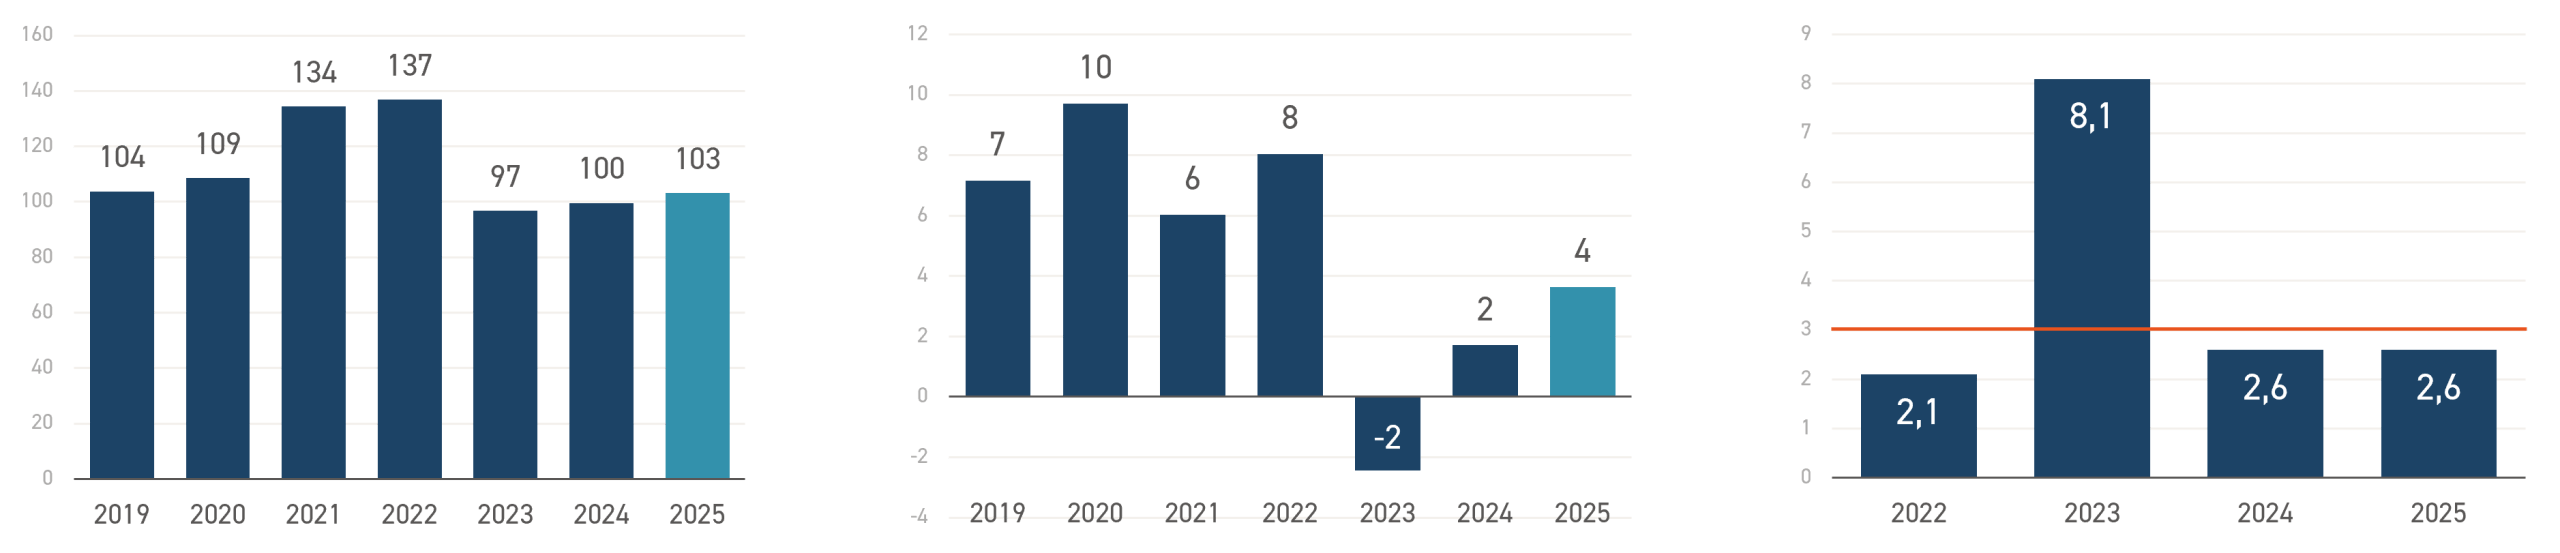
*) Last 12 months’ adjusted EBITDA
Financial targets are considered over a business cycle. Potential acquisitions may impact the long-term financial targets. According to the company’s dividend policy, Exel Composites’ ambition is to distribute a minimum of 40% of net income in dividends, when permitted by the financial structure and growth opportunities.


